
A year-end update
12 months of visual reporting, behind the scenes, dozens of folders, and new home.

Hi there!
It’s been a while, and I hope you still remember me. I’ve been a bit sidetracked lately as the news never stops and life got in the way, but as we approach the end of the year, I wanted to jump back into your inbox to share what’s been happening behind the scenes, what’s new, say hi, and wish you happy holidays.
What’s new?
This year has been intense, trying to keep up with the news. I’m proud of the work, but I realized my website no longer fits what I need. So I’m moving everything to a simpler place that lets me do more and feels more like me. It should also make it easier to share updates, personal projects, and tools, without the technical friction.
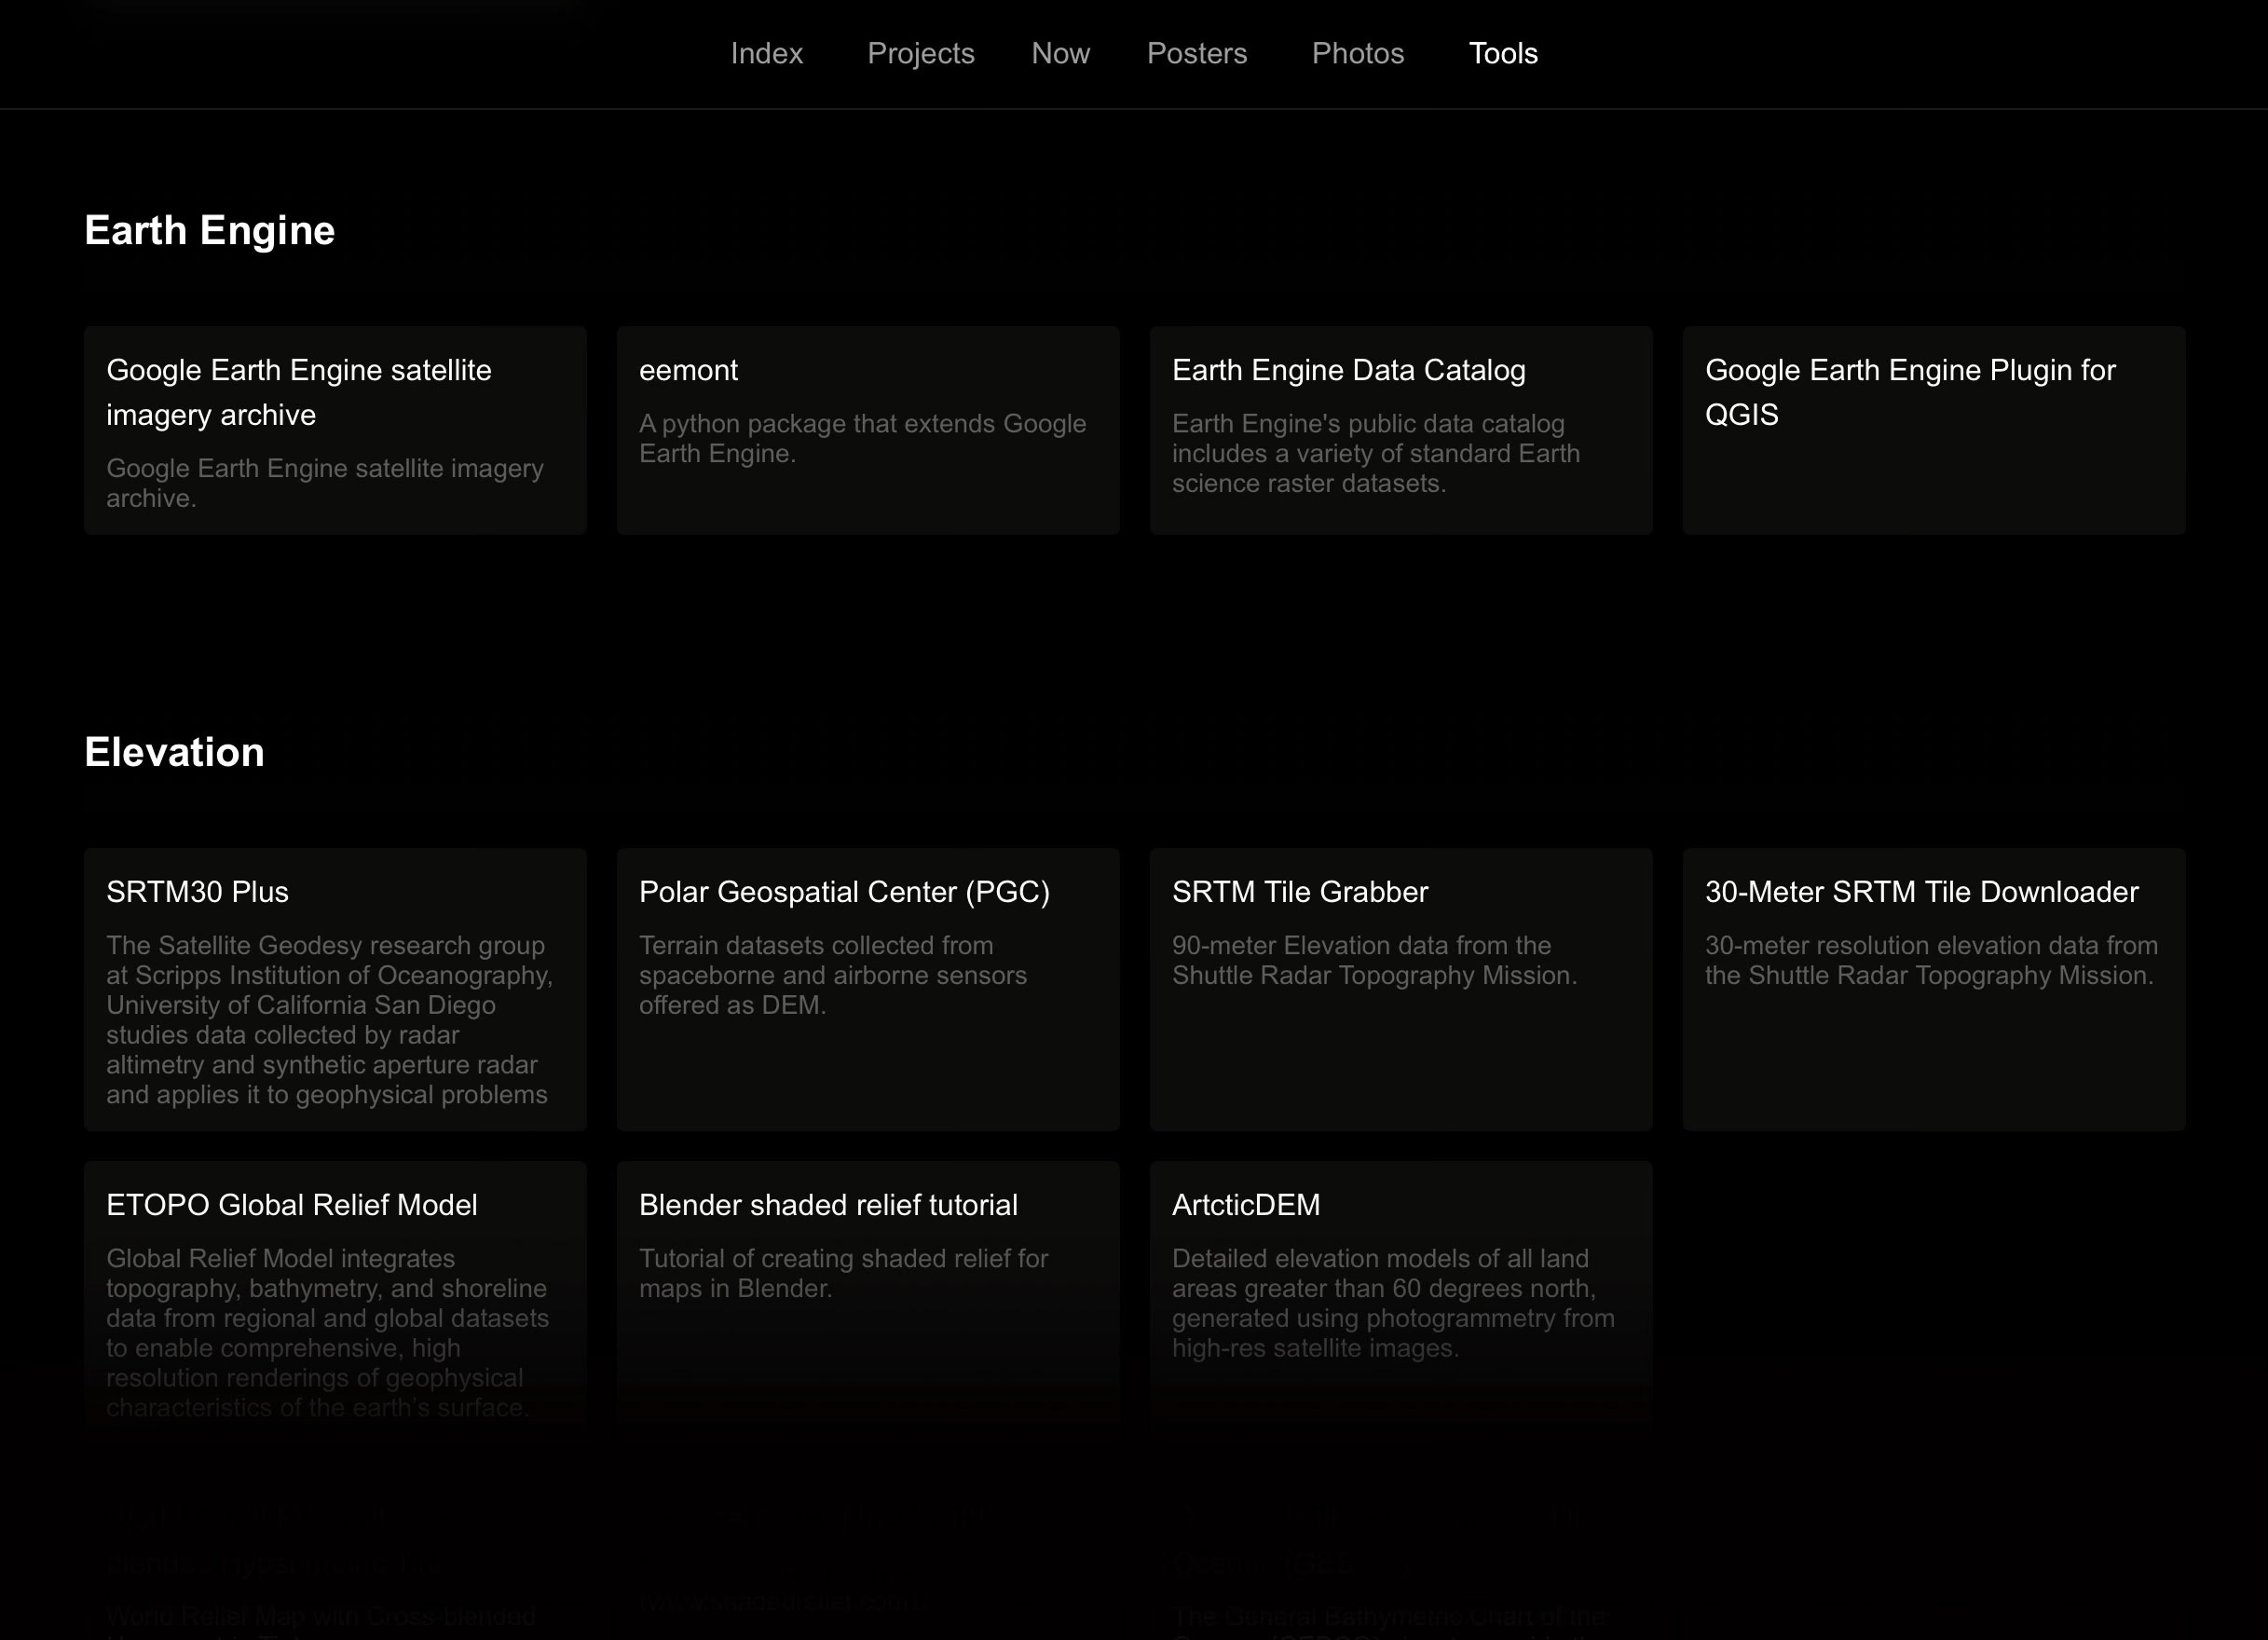
Designing your own digital space is never easy. A portfolio is never really finished. If you subscribed for the tools directory I’ve been collecting for years, that’s still happening and it’s almost ready to launch. The new site is still a bit messy, but it keeps me motivated. It will include more interviews, a dedicated section for posters and photos, and other things I’m still figuring out. I’ll be releasing it in parts.
The chaos behind the scenes
This year pushed me way out of my comfort zone. Most of the time, I was just trying to figure out how to visualize complex things under a lot of pressure in non-traditional ways.
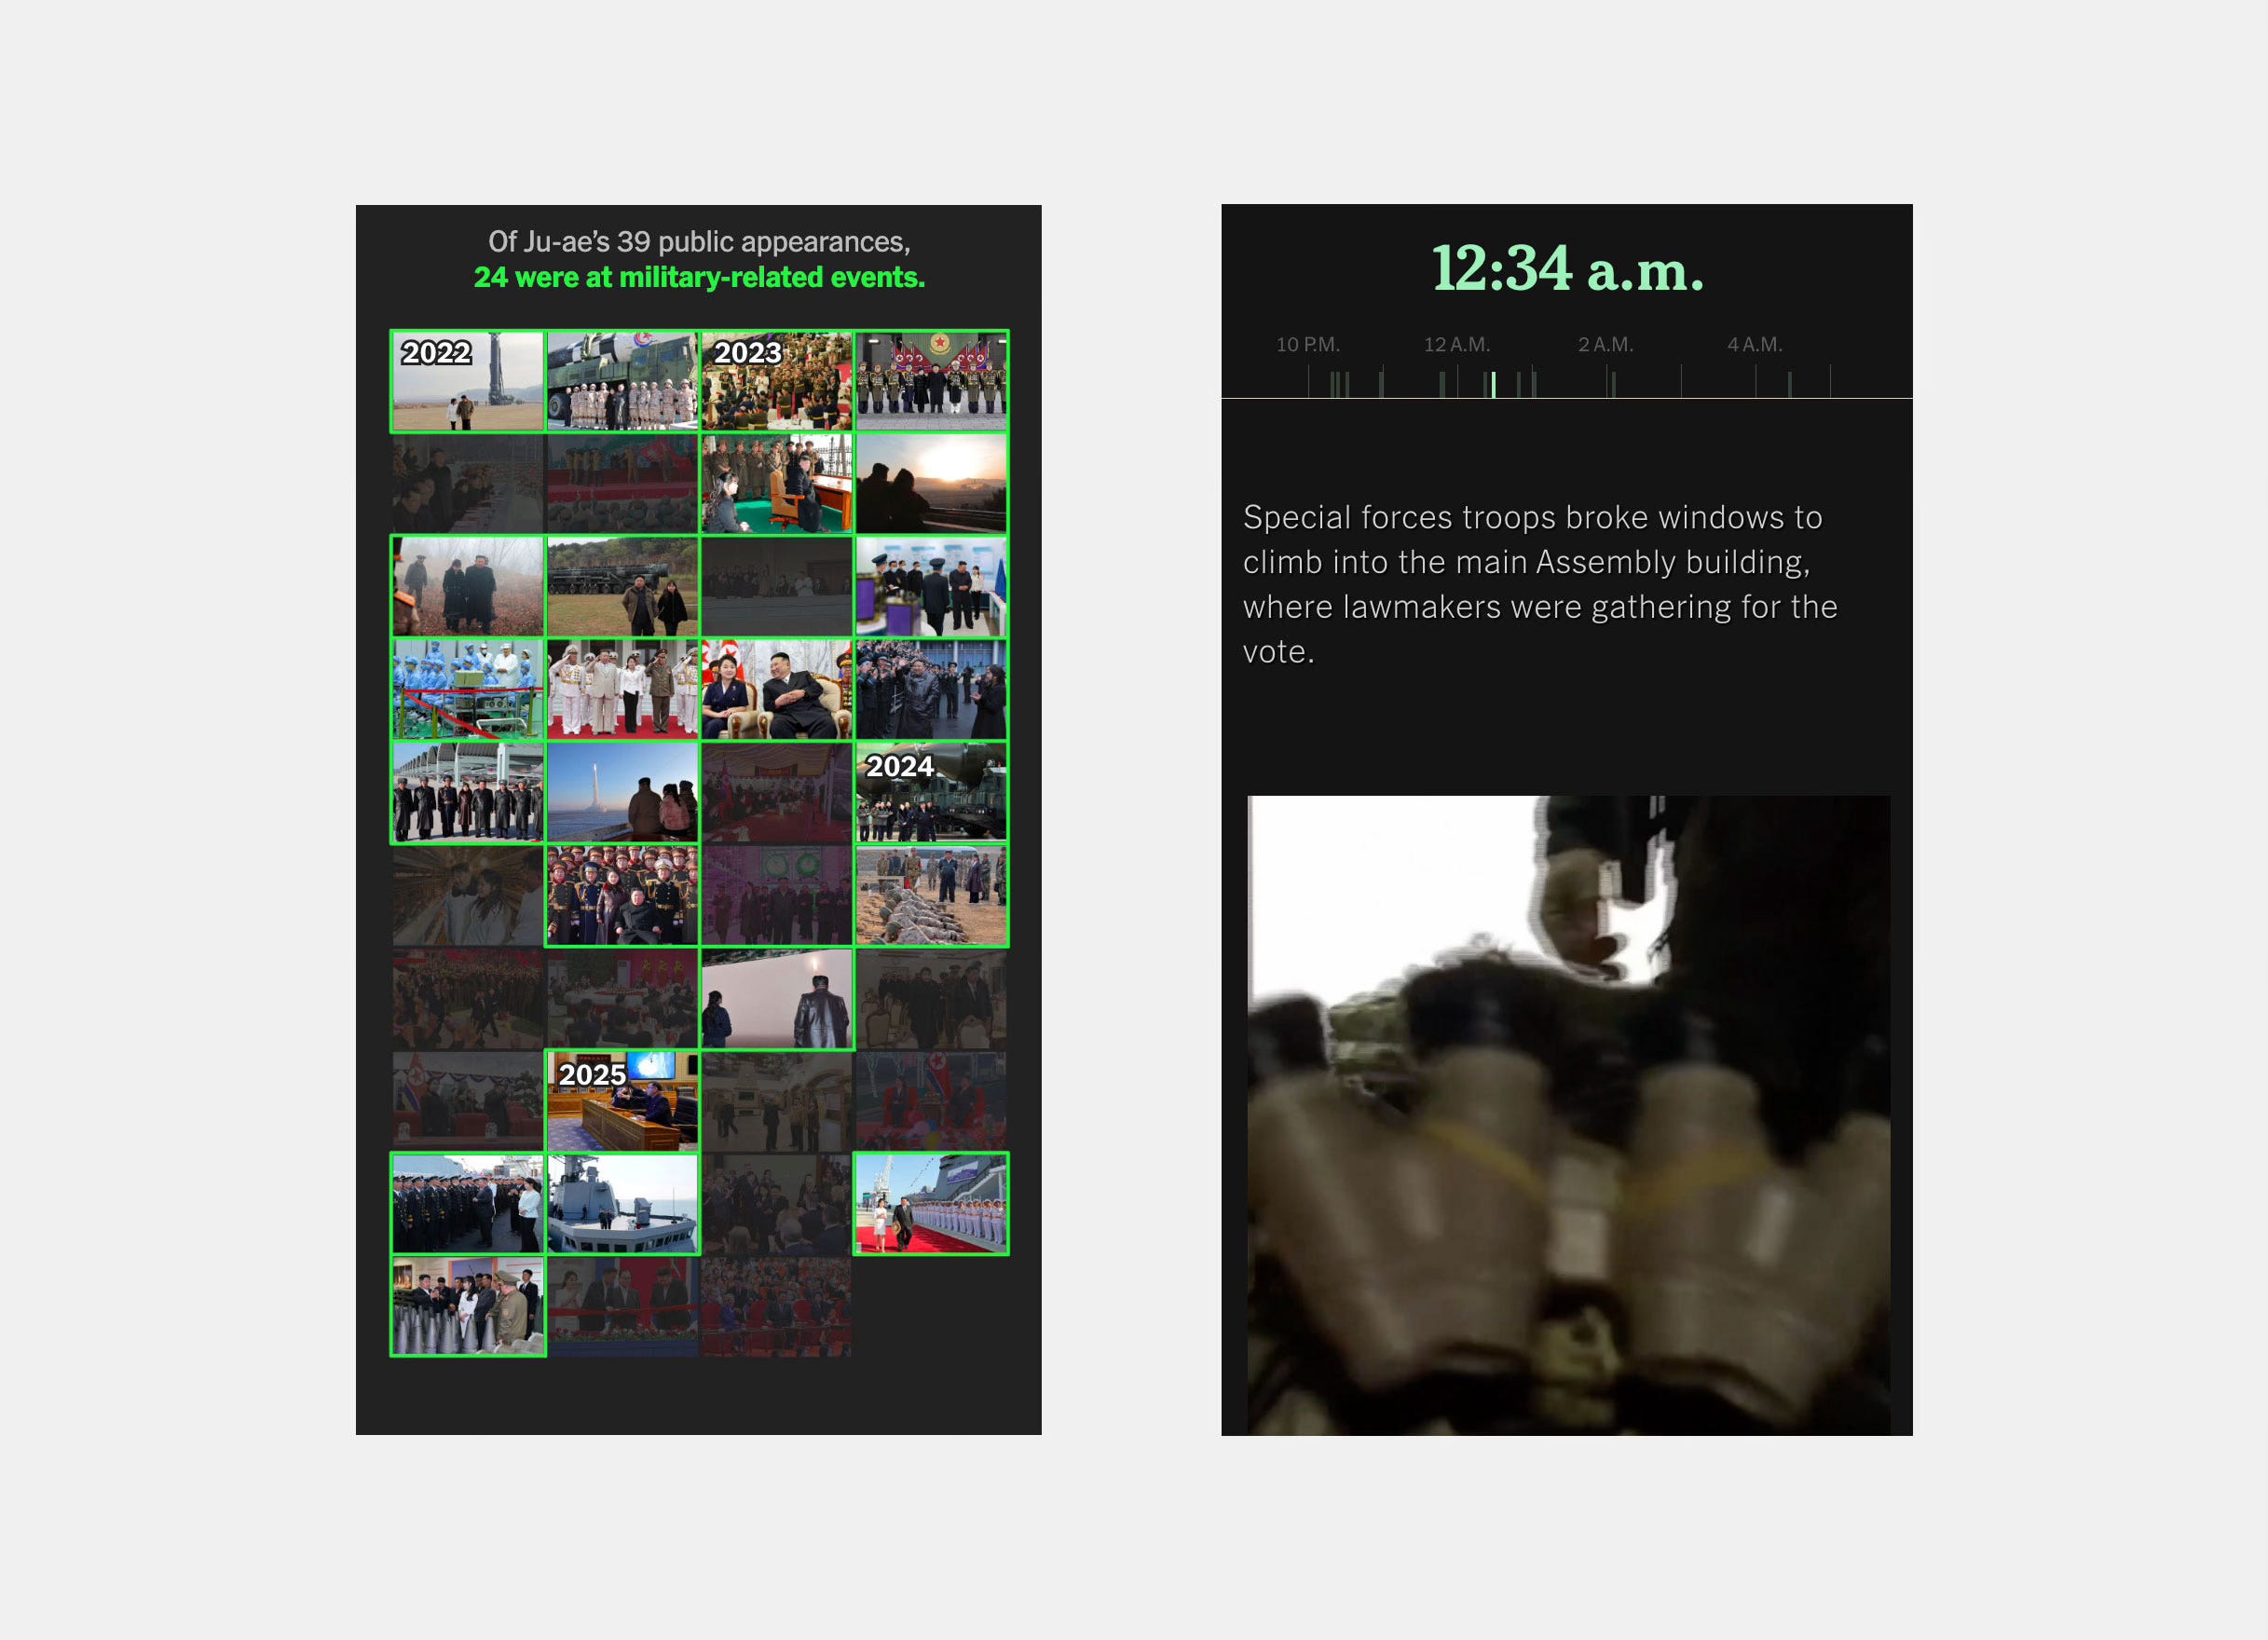
For the North Korea story, I analyzed hundreds of photographs one by one and talked to protocol experts to show how the North Korean leader presents his daughter as a possible successor. For the South Korea military takeover, I spent a lot of time working with code to build a minute-by-minute timeline to make sense of that night.
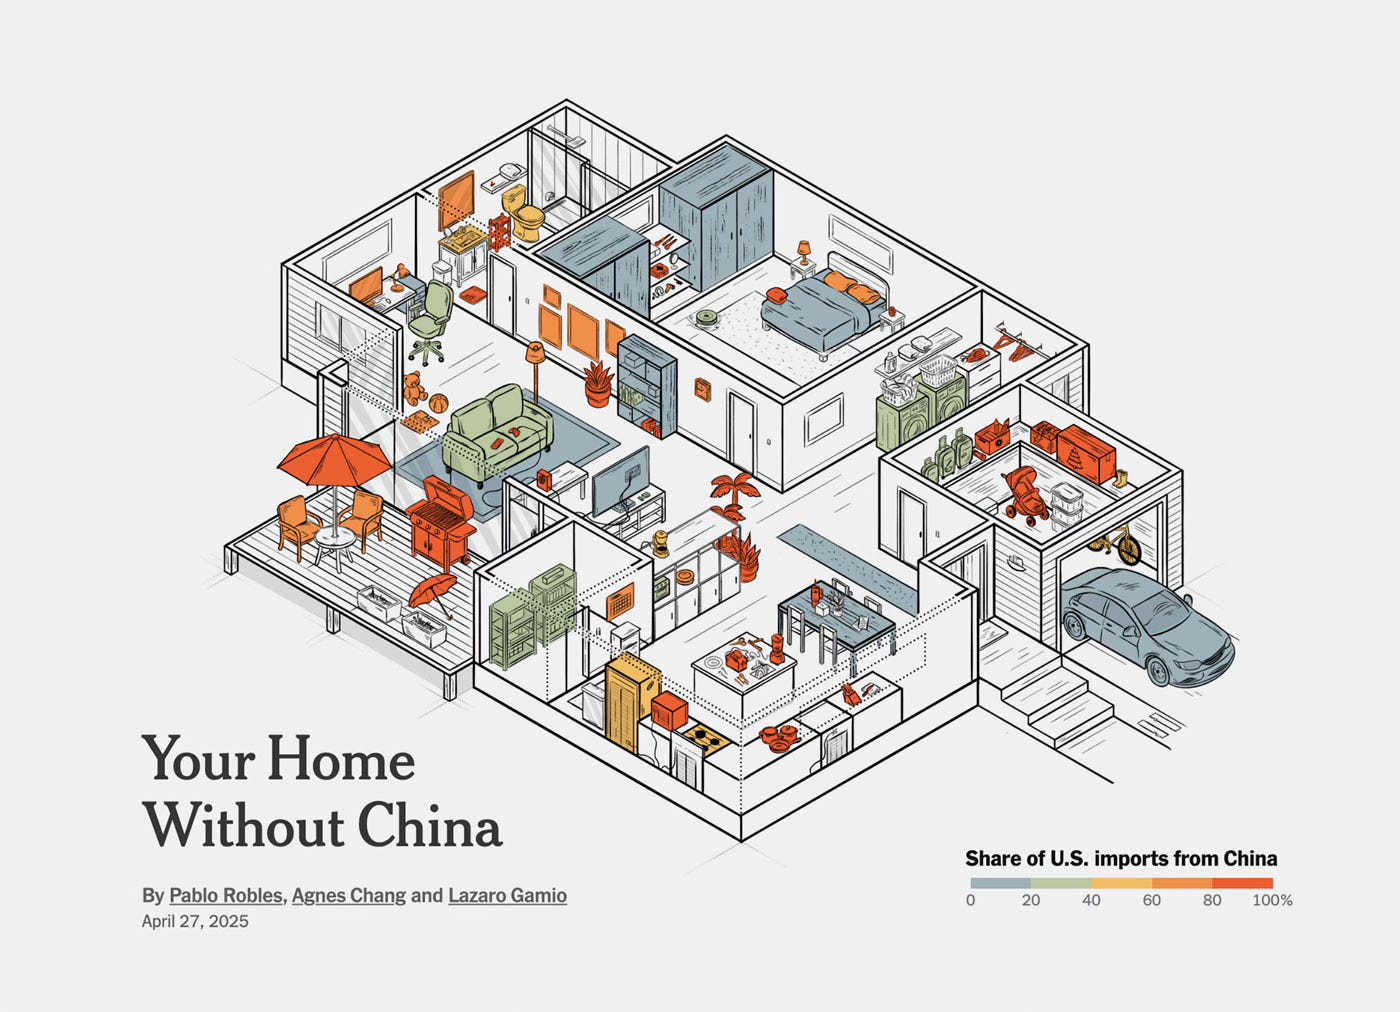
There were also moments of sheer manual labor. For the tariff rates story, I spent forever drawing and moving illustrated furniture around like a real-life mover.
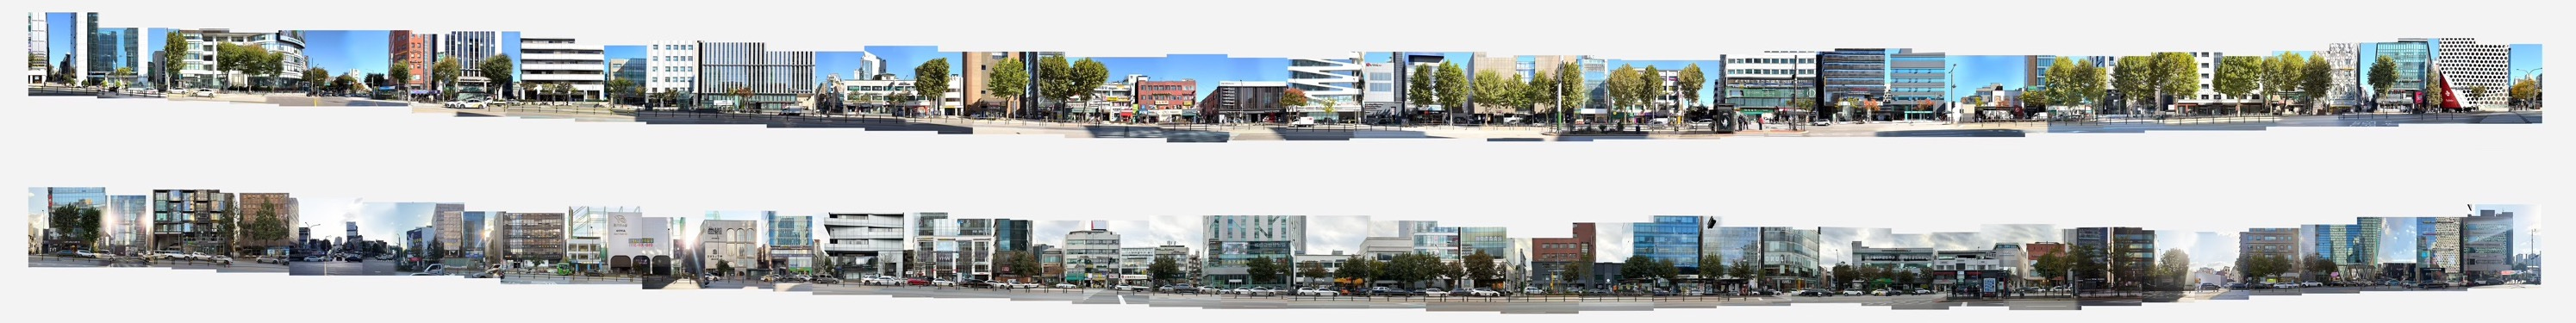
I also analyzed thousands of data points for the Seoul coffee shops piece, but I still had to walk kilometers across the city because the data on my screen didn’t always match the streets. Along the way, I took hundreds of photographs from both sides of the street and later stitched them together, geometrically aligning and adjusting each image to maintain a single, consistent perspective, resulting in a continuous composition spanning nearly a kilometer of buildings.
I even had to jump from a camping trip straight into a visual investigation of the Hong Kong fire, trying to find a different angle on a story that was already everywhere.
The most challenging part was finding the right visual “voice” for sensitive topics like Taiwan, the CIA, Uyghur workers, malnutrition in children’s bodies, or the woman chained in China. I chose to use faceless, abstract illustrations to stay respectful, after many iterations.
I’m not sharing this to make one of those “annual LinkedIn posts” nobody asked for. I just wanted to show the messy part: the hours we spend analyzing, testing, and learning new things every day to make complex topics simple for others. It’s the most interesting (and exhausting) part of this profession.
A little sneak peek
In between “surviving” the news, personal life, and keeping up with too many hobbies, I’ve been trying to steal time for personal projects. I always recommend finding time for your own stuff, because as humans, we shouldn’t be defined only by our 9-to-5 jobs. Here’s a small preview of the new website and the tools directory.
Looking ahead
This newsletter was supposed to be more frequent (I’ve said this many times now!), but life taught me that it’s not always realistic. Moving forward, I’ll send updates (small or big) whenever I can, focusing on quality over frequency and sharing new tools as I add them to the directory.
I hope you’re having a great end of the year and that you find these updates interesting, or at least a little entertaining.
Thanks for sticking around!