


#1 Newsletter - I'm back!

Hello!
It's been a while and I hope you remember me. I started this newsletter back in August 2021, but life and work got in the way, and I found myself getting a bit sidetracked. Now, I’m here on Substack, determined to continue this side project and simplify the format so we can publish more frequently but with a few improvements.
So, what's new? I've added some quick, fun “interviews” with people I admire in the creative sector, along with the usual pack of links related to inspiration, design, datasets, weekly illustrators, the latest work, and more.
Pablo talks to…
Rob Simmon, a cartographer and science communicator, specializing in visualizing satellite imagery and remote sensing. He has worked for NASA and Planet.
1. Based on physical characteristics, which planet do you think you are most similar to?
Earth — its diverse habitats reflect my diverse interests.
2. When working on a large project (and unable to find a solution for a specific problem), how do you manage to clear your mind and regain focus to solve the issue?
If I have time, I’ll go for a walk with my dog. If I don’t I’ll put on ambient music from a composer like Carl Stone or Taylor Deupree
3. What is your favorite hobby at the moment, or one you would like to take on soon?
I’ve been into sim racing for about 2 years. Getting a good lap tie requires intense focus, and there’s an addictive quality trying to get a better lap time one tenth of a second at a time. And then racing against other people heightens the intensity, because a crash won’t just ruin your race!
4. What is the project you are most proud of, and why do you feel that way about it?
It was a visualization with a very simple concept — take a picture from space, every day, directly above the equator, at 6 a.m. — that demonstrates something that is otherwise very hard to understand. That the seasons are cause by the angle of sunlight falling one a particular part of the earth, not Earth’s distance from the Sun.
5. What is your primary source of inspiration for work that's not related to your industry?
If I had to pick one, travel. No matter how interesting a spot looks from space, you learn more being there. But really I soak up ideas from everywhere.
6. What new skills did you learn from your most recent work?
My recent projects have all been self-directed, so I’ve been working on learning things I didn’t have the time or energy for previously. Code-based ways of working with data, and dipping my toes in Blender.
7. Can you share one fact about nature or space that you consider fascinating?
I think I have two. One, how limited and hackable our perception is. We build a colorful, 3D world with a tiny amount of information. Two, no matter how hard we try to put boundaries on things, there are always fuzzy boundaries. From planets to species to genres to gender there’s always a spectrum.
8. What would you say is the best way to handle large amounts of data, and what techniques do you use to take full advantage of it?
Buy a fast computer with lots of RAM! Learning how to work with cloud-based data is on my agenda. Unfortunately I find the current tools user-hostile, so it’s a challenge.
9. If you could choose a superpower to use for your work, what would it be, and why?
To learn new things instantly. Or at least faster. There are so many new technologies to try, and not enough time to learn them all.
10. What is your favorite map projection, and why do you prefer it?
Equal Earth. I’ve worked with a lot of global data, and most equal-area projections have too many compromises. My previous favorite was Hammer-Aitoff, but the oval shape and curving lines of latitude make it inappropriate for some uses.
11. Can you recommend any tools (not necessarily related to work) that you find helpful?
The library! For work I have access to some excellent online courses, and for fun it’s great to be able to download an ebook whenever.
Weekly links:
AI-powered, 1-meter resolution global map of tree canopy height ◦ Good list of spatial datasets ◦ UTD19 a largest multi-city traffic dataset publicly available ◦ Global map of offshore renewable energy production, with facilities and interconnections and supporting vessels and infrastructure ◦ 101 bits of advice, in a nice handy list ◦ 12 learnings by the designer Frank Chimero ◦ Listen to a random forest ◦ Map that visualises the 352 million assets in the Climate TRACE emissions inventory ◦ Climate archive: 109 different climate model simulations covering the climate history of the last 540 million years ◦ Eyecandy
Illustrator of the week
◦◦◦ Joe McKendry ◦◦◦
Latest work:
Since the last edition, I've published multiple stories, so I'll share them randomly until I get everything up to date:
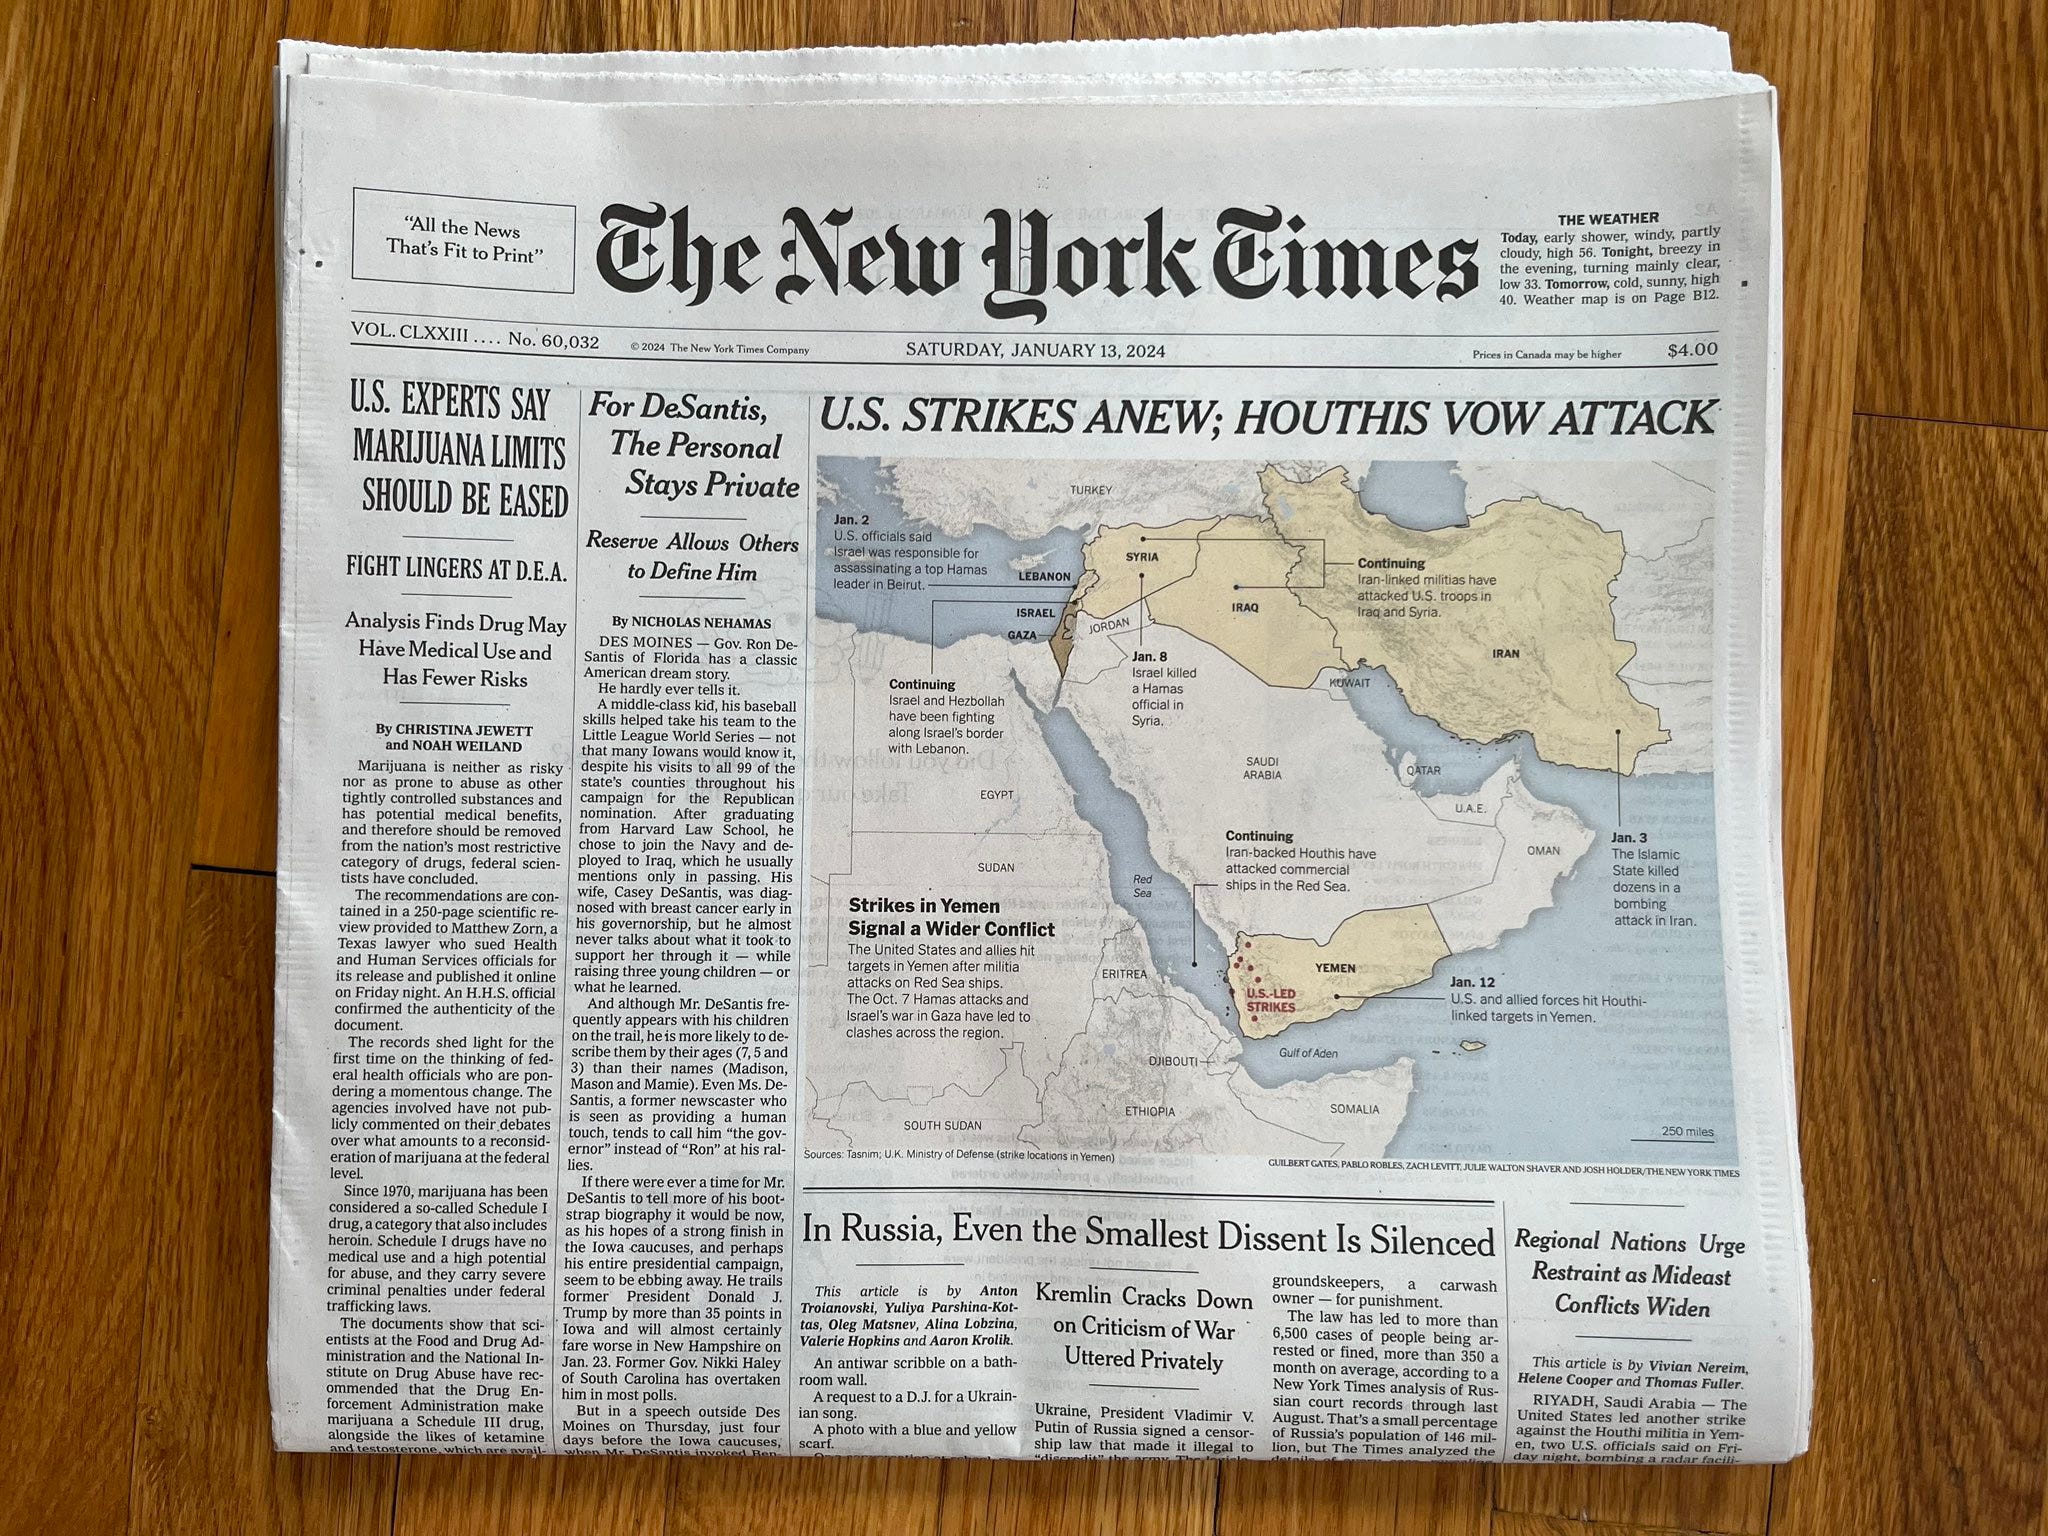
Since the Israeli invasion of Gaza, I've been involved in reporting and mapping the evolution of the war. I created a map at the beginning of the tensions in the region that made it to the front page, marking it as my first A1 graphic. Ironically, this happened during my second anniversary working for The Times.
The project I pitched, 'How to Cool Down a City,' which I collaborated on with Josh Holder, Jeremy White, and our editors, was part of the portfolio of five stories that won gold and the award for best digital news publication by the SND this week, alongside two SOPA awards nominations. It also made it to print.
I've added a new section to my website, now named 'Now,' where I sporadically update with random things but mostly answer the question 'What am I up to now?'.
__
See you next week!
Editor's note: This year, Pablo is all about green, so he is dedicating a special section to it. Soon, he will be sharing things he finds interesting, all in various shades of green.